Competitive Set Dashboard Overview
Cvent Hospitality Cloud’s Group Competitive Set Dashboard helps hoteliers understand how group demand, response patterns, and awards compare with up to 10 competitors in real time, enabling confident, data-driven group business decisions.
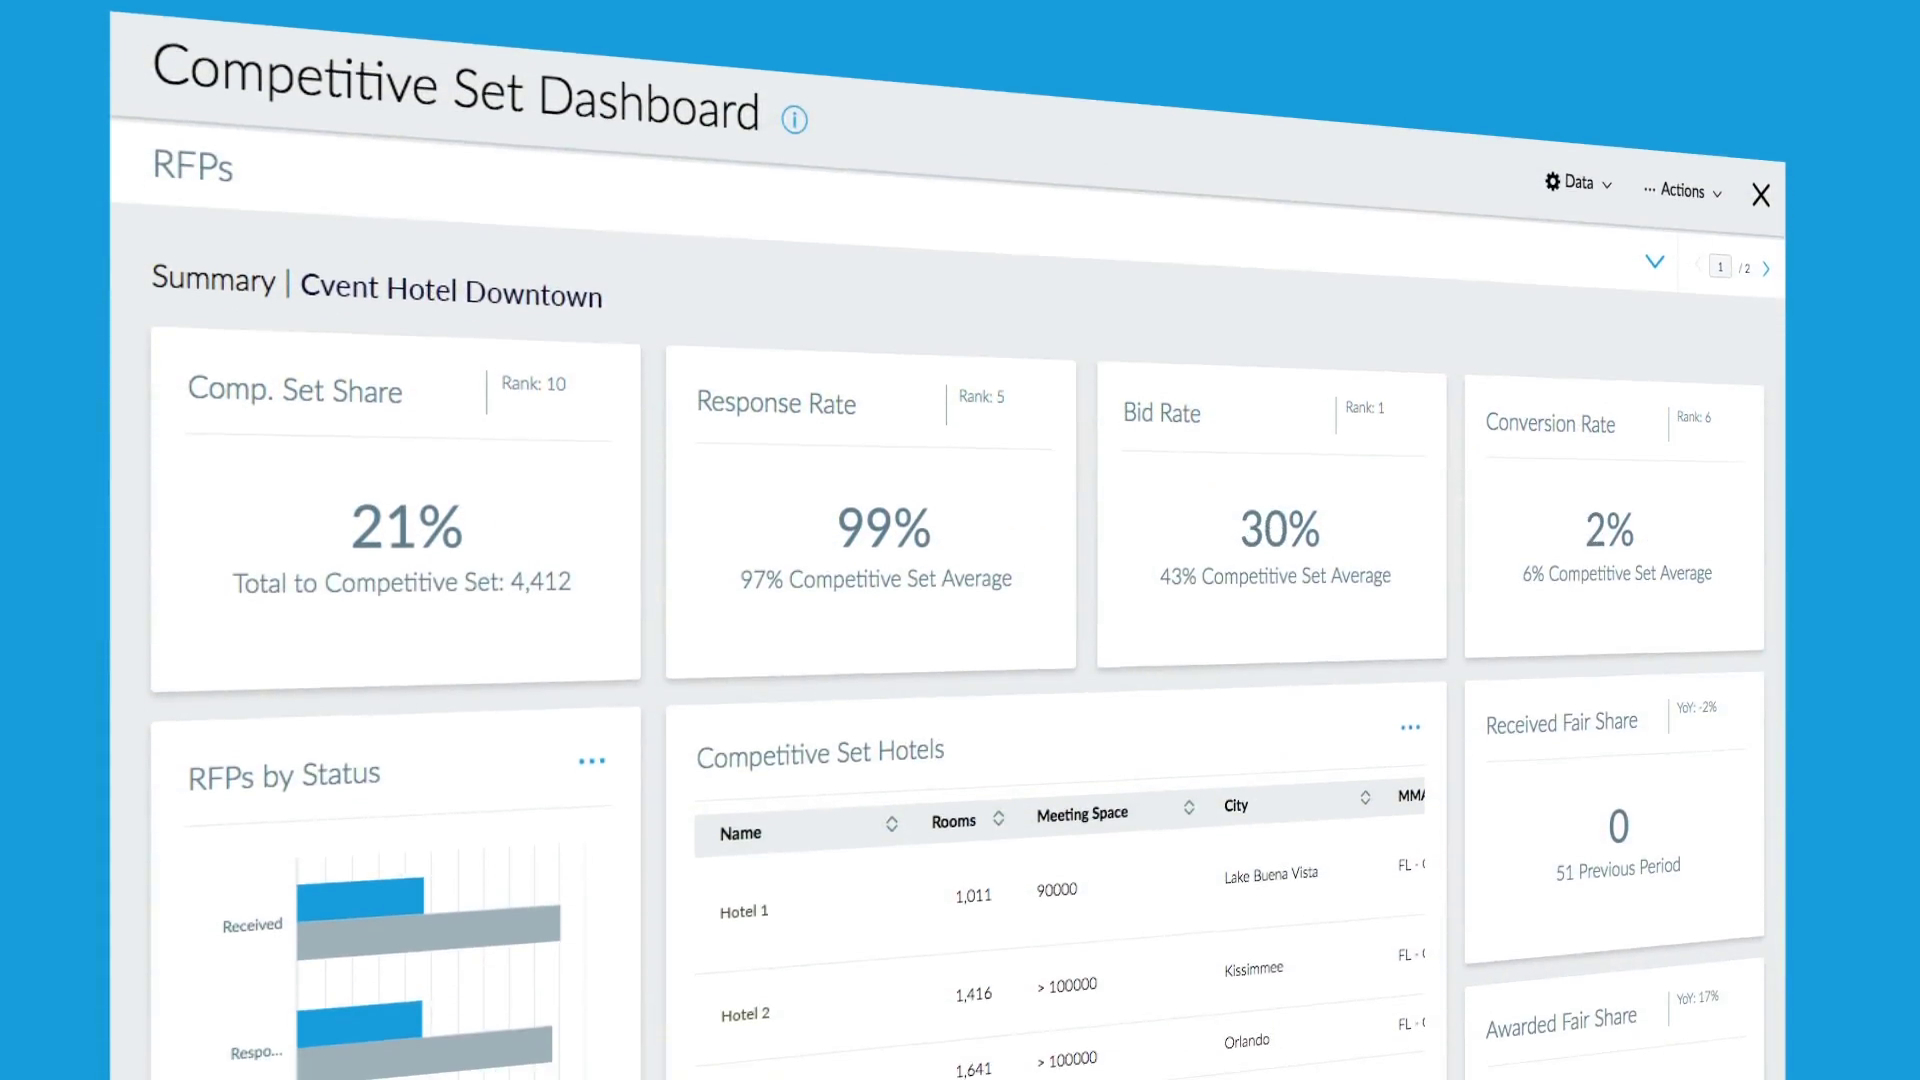
The Big Picture
The Summary section offers an overview of how your organization stacks up against the competition. This section of the dashboard reveals both absolute and relative performance throughout the sales funnel, compared with your competitive set. With a big picture view of demand, response, and award performance, you have the high-level market insights needed to adjust and optimize your sales and marketing strategy.

Details on Who, What, and Where
The Demand section offers a deeper look at received Room Nights and RFPs so you can understand the effectiveness of marketing programs compared with the competition and how open opportunities align to need dates. Learn where your demand generation efforts are succeeding, and where you can improve, with the ability to drill down to analyze specific RFPs within critical market segments.

How You Responded
The Responses section reveals how your pricing and responses stack up to those of your competitors. A timeline view of Proposed ADR versus competitors helps you optimize pricing strategy. Charts for Average Response Time and Bids across market segment, region, event size, and booking windows show how effective your organization is in handling different leads. Visualizations and sub-reports on turndowns, late responses, and missed responses help you improve conversions.

The Outcomes
The Results section of the Competitive Set Dashboard shows the high-level effectiveness of your sales and marketing programs. Visualizations of your hotel’s Awarded Room Nights or RFPs against competitors by market segment help you understand where your efforts are succeeding, and an analysis of Bid RFPs by Declined Reasons shows where you can improve.

Want to Learn About the Industry and Planners?


